Hospital porter productivity metrics for time, staffing and cost
Completing more porter jobs per shift does not automatically mean better service. Hospital porter productivity metrics are most useful when output is considered alongside working hours, staffing, costs, waiting times and care-quality indicators. No single figure shows whether patients and clinical teams are receiving timely, safe support.
A high task count can look efficient while delays, uneven workloads or difficult transfers remain hidden. A balanced view links completed work with the time and resources involved, while keeping patient flow and care in focus. This article covers key measures, how they relate to staffing and cost, and why service quality and waiting times matter. It also explains how equipment designed for patient transfers and bed movement can help reduce the physical demands on healthcare staff.
Table of Contents
Healthcare staff output relative to time, money and staffing
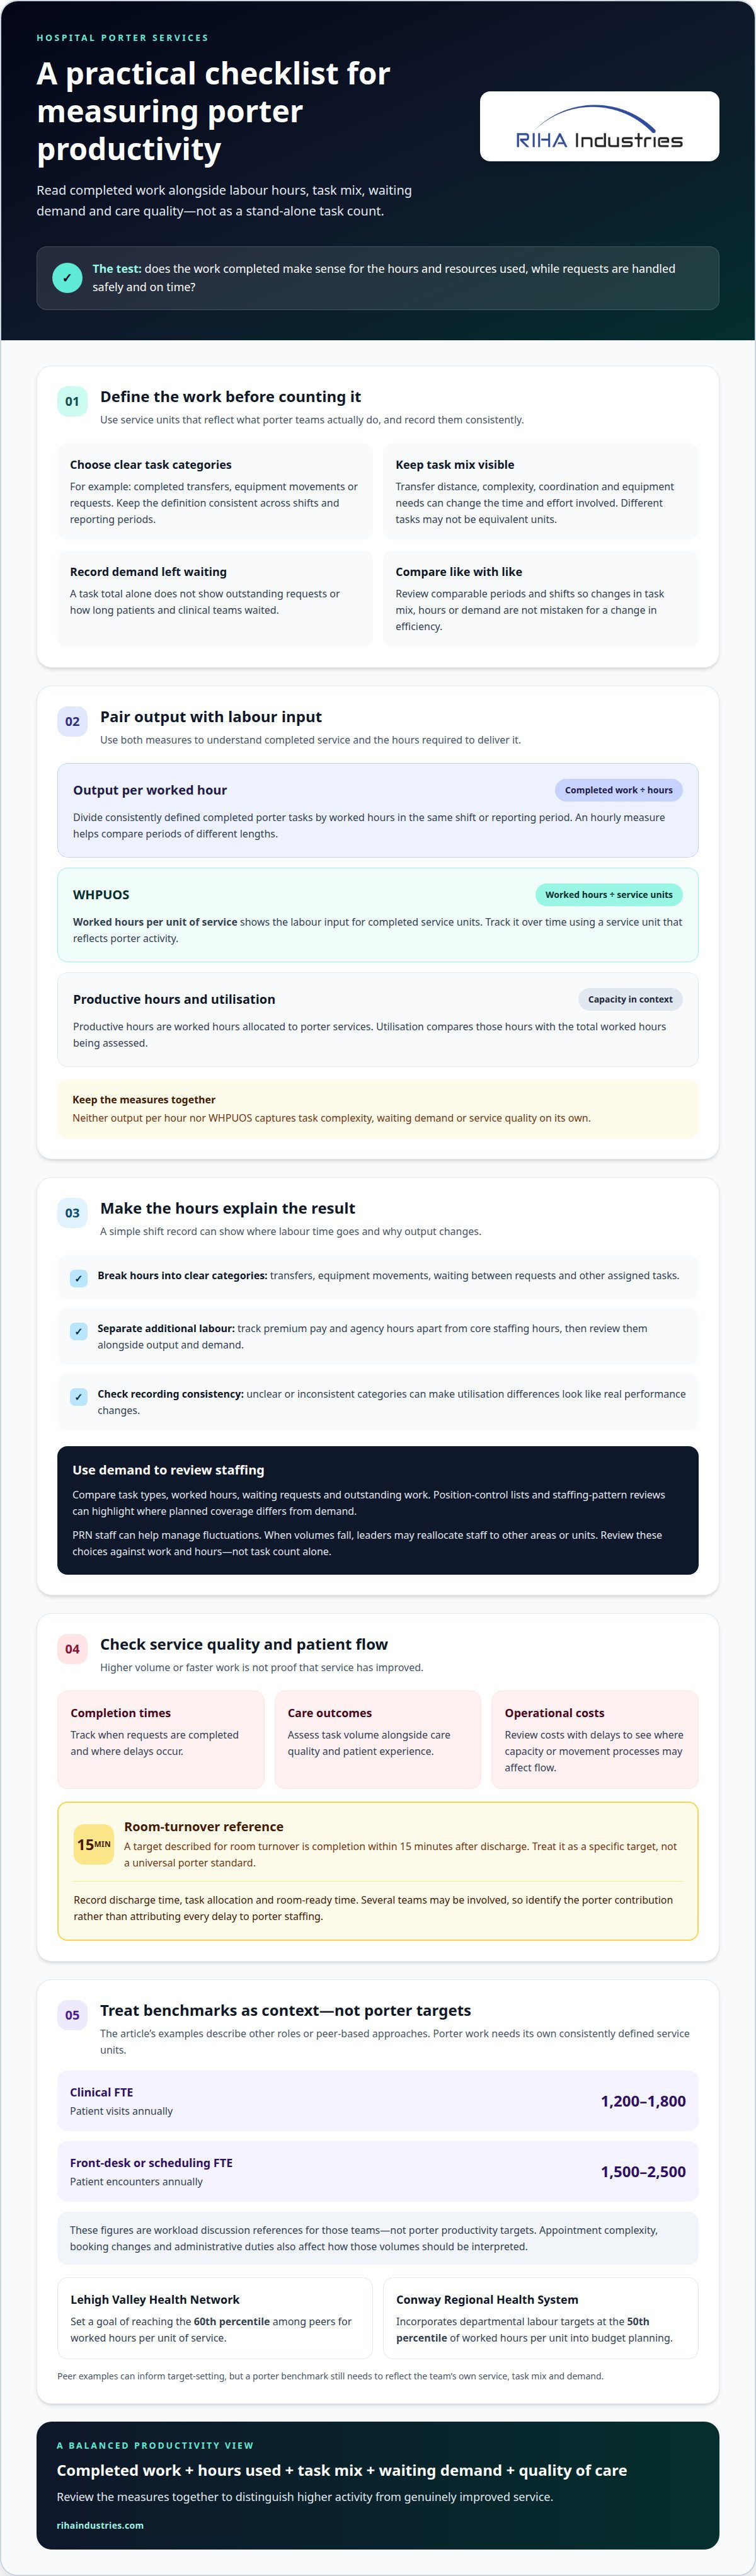
Porter output is meaningful only alongside the hours and staffing needed to deliver it. Counts of completed moves, equipment deliveries or room-related tasks show activity, but not the time each task took or the demand left waiting. For useful hospital porter productivity metrics, compare completed work with worked hours, staffing levels, delays and task type. This helps leaders distinguish higher activity from improved efficiency.
Benchmarks can inform workforce planning, but figures for other roles are not porter targets. General benchmarks include 1,200-1,800 patient visits per clinical FTE annually and 1,500-2,500 patient encounters per front-desk or scheduling FTE annually. These measures help frame workload discussions for those teams. For porters, define a unit of work that reflects the service, then compare completed units with hours and demand across comparable periods.
Front-desk and scheduling volumes need separate interpretation. An FTE’s encounter count may vary with appointment complexity, booking changes and administrative duties. Similarly, a porter’s task total can change with transfer distance, equipment needs and coordination with clinical staff. Recruitment decisions should consider the mix of duties and outstanding work, not just a volume benchmark or total headcount.
Room preparation adds another operational measure. A target described for room turnover is completion within 15 minutes after discharge. Treat this as a specific turnover target, not a universal porter standard: the work may involve several teams, and the porter’s contribution should be identified separately. Recording the discharge time, task allocation and room-ready time can help locate delays without attributing every hold-up to porter staffing.
Staff mix matters as well as total FTEs. In care delivery, relying solely on registered nurses without support from aides or technicians can be expensive and inefficient. For porter services, leaders can examine which tasks need porter support and whether clinical staff are spending time moving equipment instead. Before changing staffing or recruitment plans, compare task types, worked hours and waiting demand.
Patient volumes fluctuate, so a fixed staffing pattern may not suit every shift. Position-control lists and staffing-pattern reviews can reveal where planned coverage differs from demand. PRN staff can help manage fluctuations, while leaders may reallocate staff to other areas or units when volumes fall. Review these decisions against completed work, waiting tasks and hours used, rather than treating a higher task count as proof of better efficiency.
Worked hours per unit of service (WHPUOS)
WHPUOS can be used to relate worked hours to service units delivered. To calculate porter output per shift or hour, divide comparable completed tasks by the worked hours in the same period, then track the result over time.
Hospital porter measures can include completed transfers, equipment movements or requests, as long as each unit is defined consistently. WHPUOS reverses that calculation: divide worked hours by completed service units to find the labour input per unit. Neither measure alone captures task complexity, waiting demand or service quality.
Productive hours and porter utilisation
Productive hours are the worked hours allocated to porter services. Utilisation compares those hours with the total worked hours being assessed. Together, these measures help managers see whether staffing capacity is going towards assigned work or being absorbed by other duties and delays.
For example, a shift record can break down hours spent on transfers, equipment movements, waiting between requests and other assigned tasks. Clear categories make tracking more useful. Without them, apparent differences in utilisation may reflect inconsistent recording rather than a genuine change in the team’s ability to complete work.
Output per worked hour
Output per worked hour is the number of completed, consistently defined porter tasks divided by the hours worked during a shift or reporting period. A shift-level calculation compares total output with hours worked; an hourly measure makes it easier to compare periods of different lengths.
Keep task types visible. A completed transfer and a move requiring extra coordination should not automatically count as equivalent units if their workloads differ. WHPUOS can show hours per task category, while output per hour shows completed units per labour hour. Together, these measures help show whether a change reflects staffing, task mix or output.
Hospital labour targets should provide a comparison, not a fixed answer. Lehigh Valley Health Network set a goal of reaching the 60th percentile among peers for worked hours per unit of service. Conway Regional Health System incorporates departmental labour targets at the 50th percentile of worked hours per unit into budget planning. These examples show how peer benchmarks can inform targets, but porter teams still need a service unit that reflects their own work.
Track premium pay and agency hours separately from core staffing hours to show how additional labour relates to output and demand. If agency shifts are routinely scheduled while core staff are flexed during low-volume periods, staff morale may suffer. Reviewing labour mix alongside WHPUOS can reveal challenges that a single productivity target might conceal.
Balancing work volume with quality of care
Assess porter output using task volume, worked hours, completion times and quality outcomes. Travel distance, task complexity, coordination and equipment availability also affect how quickly porters can complete requests.
FTE estimates from volume inputs
An FTE estimate translates expected task volumes and the time required into staffing hours. Start with recorded requests by task type, then estimate the workload based on how long each category takes. Compare the total with available staff hours to estimate the workforce needed for the expected volume.
Separate routine movements from tasks that need extra coordination or equipment. This is more useful than applying one average time to every request. Review the inputs as demand changes: a shift with more complex transfers may need different coverage even if its task volume is similar.
Task volumes and completion times
Task volume counts the porter requests received or completed; completion time shows how long each takes. Record both for each shift, distinguishing completed requests from those still waiting. This helps leaders determine whether a lower completion count reflects reduced demand, longer tasks or a growing backlog.
Pair these measures with quality indicators, such as missed requests, delays and service feedback. A study summarised in a review found negative productivity growth for hospital treatment of heart attack, heart failure and pneumonia between 2002 and 2011 when output lacked quality or patient-severity adjustments. Volume alone can therefore misrepresent outcomes.
Adding FTEs does not automatically improve quality or patient satisfaction. For porter services, compare staffing changes with completed work, waiting requests and service outcomes. A balanced view can help refine coverage without treating a higher task count as proof of better care.
Travel distance and equipment availability
Travel distance affects the time available for each request because porters must move between locations as well as complete the task. Record the origin, destination and task type to distinguish a nearby transfer from one involving a longer route. This helps explain differences in completion times across units.
Equipment availability also shapes workflow. If equipment needed for a task is in use elsewhere, a porter may have to wait or coordinate its return. Track these interruptions alongside task times, not just completed jobs. This helps show whether delays relate to staffing, distance or equipment access.
Hospitals can review FTEs daily or each pay period against current patient volumes. Compare task demand, completion times and quality indicators, then adjust staffing where workload patterns differ. This connects porter capacity with service outcomes instead of relying on volume as the sole measure.
Reducing waiting time and operational costs
Waiting time and labour cost should be considered together, not as separate operational concerns. Porter services can track request-to-arrival time, completion time and unassigned requests alongside worked hours. These measures show whether delays cluster around particular locations, shifts or task types, and whether staffing changes correspond with shorter waits rather than simply more completed tasks.
Set a clear baseline by recording when each request is received, assigned and completed. For example, compare average waits for transfers and equipment movements, then review the trend by department. If one area repeatedly has longer delays, examine its demand pattern, travel routes and task mix. This can reveal operational constraints before leaders adjust coverage or redeploy staff.
Cost figures from broader hospital staffing models provide context, not porter-specific targets. Any estimate relates to the unit’s staffing approach, not an expected saving from porter productivity changes. Keep this distinction clear when assessing local porter costs.
Comparative figures also need their setting and period attached. From January through June 2024, Providence medical-surgical units in Washington had average labour cost per patient admission 36% lower than comparison organisations. In Texas, the difference was 18% for medical-surgical units and 30% for progressive care step-down units. These results describe those unit comparisons, not savings attributable to porters.
For porter teams, link labour inputs to operational results they can influence. Compare hours used with completed tasks, waiting requests and completion times. Review average waits alongside the number of requests arriving in each department. Lower labour costs may not indicate improved efficiency if requests remain unassigned or delays increase.
Trends across comparable shifts can guide targeted changes. If waits in one department rise during busy periods, leaders can review task allocation, coverage and movement routes, then compare the same measures after an adjustment. Cost and waiting-time reviews are most useful together: they show how a change affects labour hours, completed work and outstanding requests.
Task assignment and progress monitoring
A visible task queue helps coordinators match porter capacity with active requests. For each job, record its type, location, priority, assignment status and completion time. A transfer awaiting a porter, for example, should remain visible until it is assigned and completed. This lets teams measure outstanding work as well as finished tasks, rather than assuming a busy shift means every request was handled.
A brief 10-minute morning huddle can align the team around the day’s schedule. Review planned transfers, known equipment movements, department priorities and coverage. If a unit has several scheduled moves, assign responsibility before requests accumulate. The huddle also gives staff a shared understanding of who will monitor incoming work and how changes in demand should be communicated during the shift.
Use clear status categories throughout the day, such as received, assigned, in progress and complete. Record a reason when a task pauses, such as waiting for coordination or equipment. A request marked in progress for an extended period needs a different response from one that remains unassigned. Consistent records also make it easier to compare similar shifts without confusing different task stages.
Review the queue at agreed intervals and compare incoming requests with completed work. If outstanding transfers grow while equipment movements remain steady, coordinators can reconsider task allocation or seek support from another area. Respond according to work type and urgency, not just the total count. Record the change and its effect on the queue to assess whether it improved flow.
Accurate service credit matters. If a department performs work but its hours or activity are recorded elsewhere, its measured productivity can be distorted. For example, when a Radiology Tech performs imaging in the operating room with a C-arm, and the technician’s expense and hours are charged to Radiology, Radiology should receive unit-of-service credit. Correct attribution makes departmental comparisons more meaningful.
Use trend reviews to distinguish recurring constraints from one-off peaks. Compare task completion, outstanding requests and recorded hours across matching shifts, then look for repeated patterns by location or task category. Formal productivity analysis can reveal opportunities for 20-30% improvement in healthcare practices, but that figure is not a porter-specific forecast. Treat it as a reason to examine processes, not as a promised result.
Close each review by assigning an owner to any unresolved task or process issue. A clear handover should state the request, current status and next action, so the incoming team can continue without restarting the search. If patient movement tasks are part of the operational challenge, explore patient movement equipment as one consideration in planning.
RIHA Industries: StaminaLift Transfer System 5000
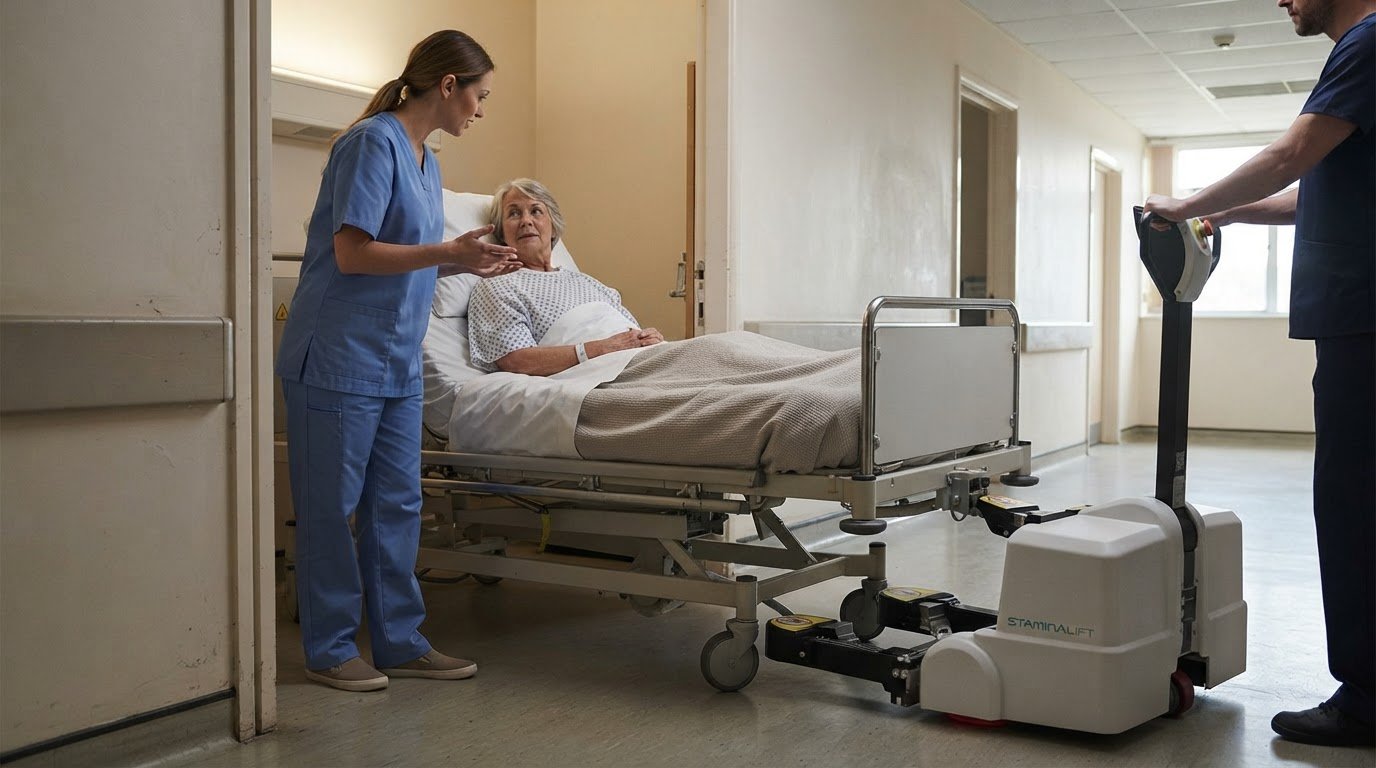
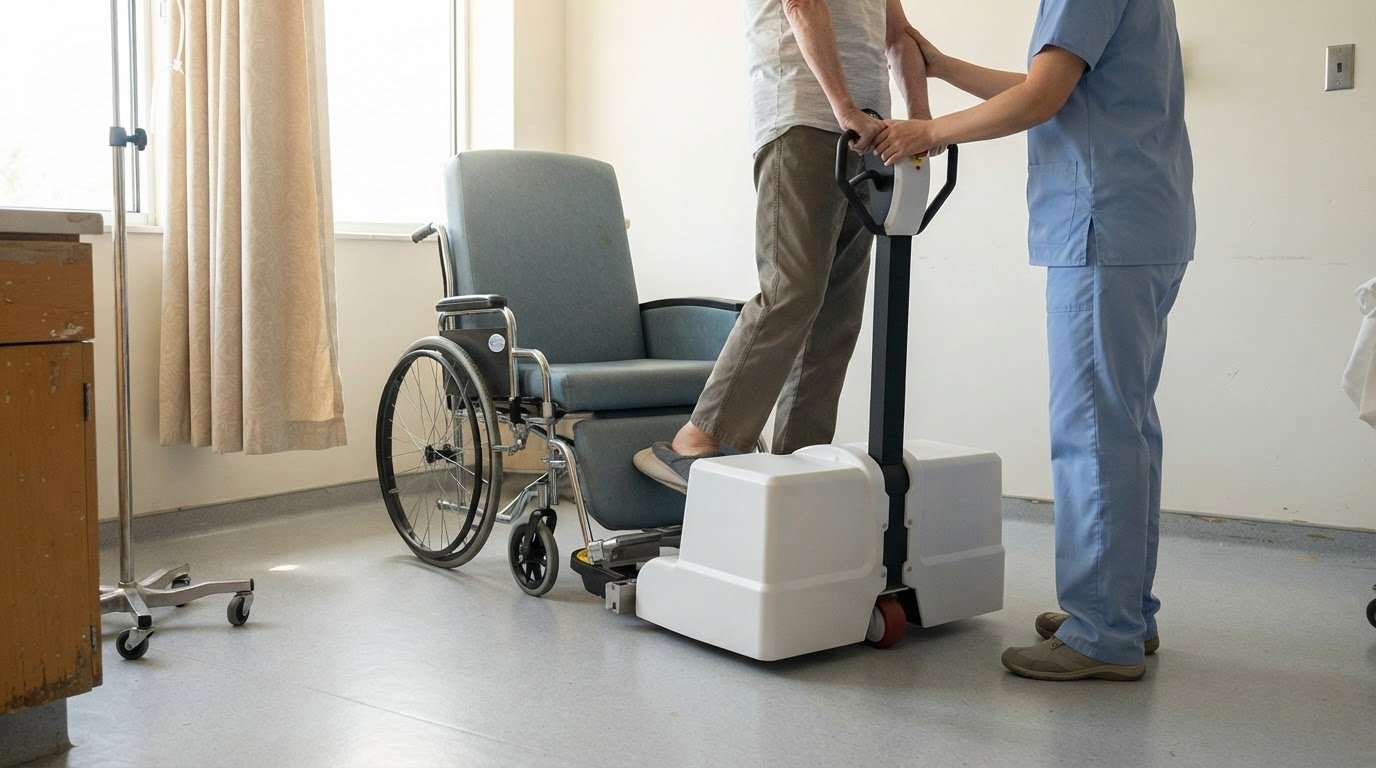
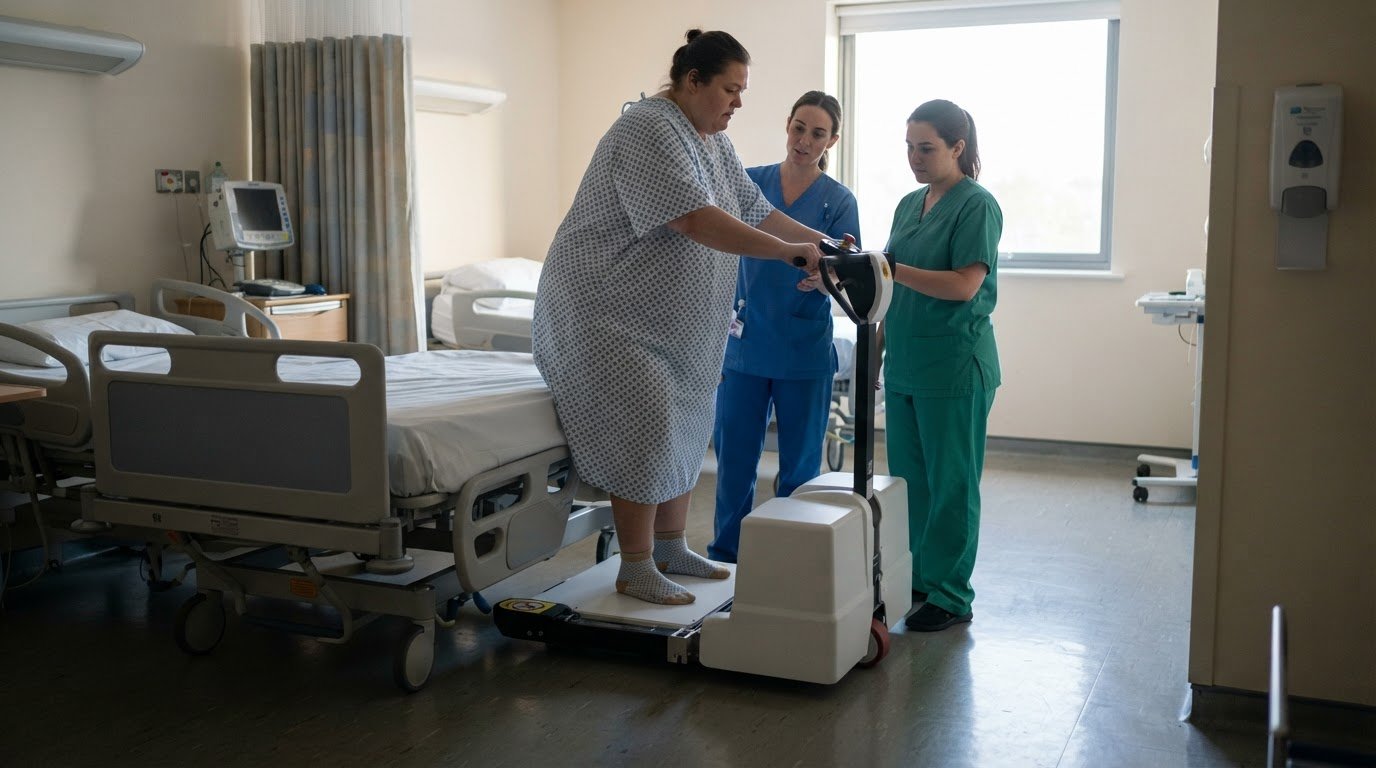
RIHA Industries’ StaminaLift Transfer System 5000 is designed to support patient transfers and integrate with existing hospital equipment. It may be relevant when porter workload reviews identify frequent transfer tasks or movement demands that warrant closer assessment. Consider the system in the context of the tasks, equipment and workflows already measured, rather than treating it as a productivity target on its own.
For bed movement, RIHA Industries also offers the StaminaLift 2100 Bed Mover and StaminaLift Transfer System 6000. The right equipment category depends on the movement task and its place in hospital operations. Reviewing these needs alongside porter activity can help teams evaluate whether their current approach suits the work.
Contact RIHA Industries to discuss equipment for patient transfers and bed movement.
Turn measurement into a practical next step
Make your next step a focused review, not another dashboard. Select a porter workflow that matters to staff and patient flow, then agree who will interpret the results and act on them. A concise decision brief can link the measures to the operational issue, outline what should change and explain how the team will assess the effect.
Use hospital porter productivity metrics as a shared reference for conversations between porters, coordinators and department leaders. Their perspectives can reveal where recorded activity misses day-to-day constraints, helping teams make decisions that reflect service demands and working conditions. Keep the review practical: clarify the issue, identify the action and set a time to revisit progress.
If patient transfer and bed movement equipment forms part of your operational review, contact RIHA Industries to discuss your requirements. A clear, evidence-led next step can help your team improve how it plans and supports porter work.
Frequently Asked Questions
Does the measure account for quality or outcomes?
Not on its own: a task count records volume, not whether the service met the need. Pair output with indicators such as requests completed on time, repeat requests and relevant service feedback. For example, a department might complete many equipment moves while a clinical area still experiences delayed deliveries. Reviewing both measures helps distinguish activity from useful outcomes and shows where further investigation may be needed.
How can hospitals ensure compliance and privacy in productivity tracking?
Focus tracking on operational information, not unnecessary patient details. A porter dispatch record can use a task reference, location, category and status instead of a patient’s name. Limit access to staff who need the data, and follow the hospital’s established privacy processes for retention and review. Reports shared across departments can use grouped results to analyse workload without unnecessarily exposing individual task records.
What are typical hospital porter jobs completed per shift benchmarks?
There is no single useful shift benchmark for every porter team because job counts depend on task type, route, demand and local workflow. A bed movement and a short equipment delivery may require different effort, so raw totals can mislead. Establish a baseline by separating common job categories, then compare similar shifts and locations. Use the results to understand local capacity, not to set a universal quota.
How are porter response time and transport turnaround time measured?
Response time is the interval from a request being logged until a porter arrives or accepts the task, as long as the hospital defines the endpoint consistently. Transport turnaround can measure the time from task acceptance until the move is completed and recorded. Capture a timestamp for each event. For example, distinguish time spent awaiting clinical coordination from active porter movement so delays are attributed to the right stage.
What staffing ratios are recommended for hospital porters by bed count or patient volume?
Set porter staffing according to local request patterns rather than applying a bed-count ratio without context. Review when requests arrive, the mix of transport tasks, distances between departments and coverage needs across shifts. A hospital with concentrated movement peaks may need a different schedule from one with steadier demand, even if bed numbers are similar. Compare workload and outstanding requests with available porter hours to assess coverage.
How do hospitals measure porter service quality and patient safety?
Combine operational records with feedback and safety reporting. Hospitals can review whether requests were completed as assigned, transport delays were recorded, and staff or patients raised concerns. Incident and near-miss reports can reveal recurring hazards, such as congested routes or unclear handovers. Review examples with the relevant teams, then track whether agreed changes improve service without compromising safe practice.
How can hospitals track porter productivity using dispatch or workforce management software?
Configure task records to capture request time, task category, location, assignment, status changes and completion. A dispatch view can show coordinators unassigned work, while shift reports can compare task mix and hours across similar periods. Use consistent categories to interpret trends reliably. Keep patient-identifying details out of routine productivity reports unless needed for the operational purpose.
What are the risks of setting hospital porter productivity targets too high?
Targets based only on speed or task volume can encourage staff to prioritise simple jobs while complex requests wait. They may also discourage teams from recording delays that affect apparent performance. For example, a porter might focus on quick deliveries while a time-sensitive transfer remains in the queue. Set targets alongside task complexity, outstanding work and service quality, and review how staff experience the workload.